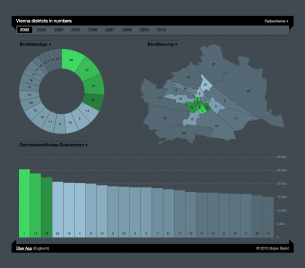
Vienna districts in numbers is an data visualization application, written in JavaScript, based on the open data. Here’s a bit about how this came to be. (more…)
Vienna districts in numbers is an data visualization application, written in JavaScript, based on the open data. Here’s a bit about how this came to be. (more…)